Email design
Personalized Charts in Email: What Works and What Breaks
A report email, taken apart
Most advice about charts in email ends at "use an image". That's the easy part. The hard part is deciding which chart, how big, what sits next to it and what you leave out.
Spotify Wrapped is the best-known proof that less works. It doesn't hand you a dashboard: it picks a handful of your listening highlights, gives each one a single takeaway and leaves the rest in the app. A usage report can borrow that selectiveness without turning into a year-end show.
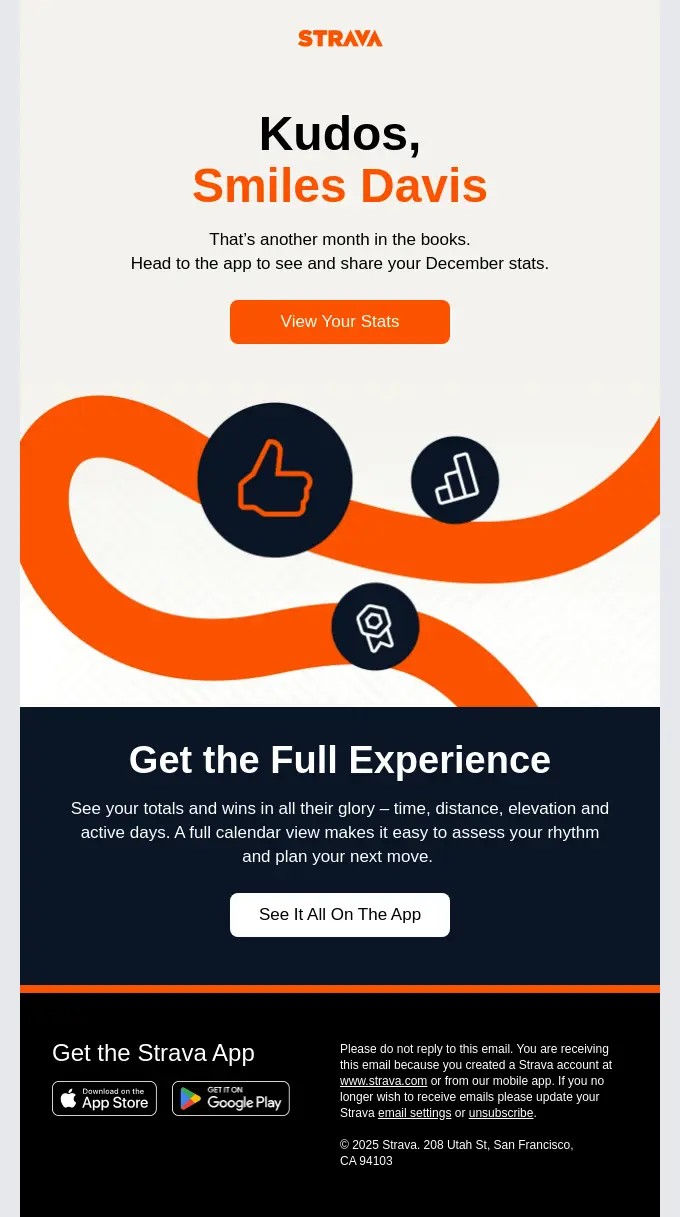
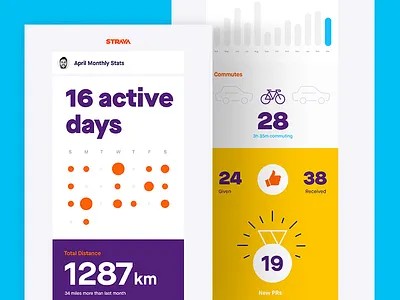
Strava has sent both kinds. One version of its monthly stats email holds no numbers at all: "Head to the app to see and share your December stats", a button, done. The other puts the month in the email itself: 16 active days on a dot calendar, 1,287 km in total, commutes, kudos given and received, new PRs. Strava started with the link and moved to charts, and it has stuck with them since, because the charts get the better figures.
So here's a real one. "Your October with the Chamaileon SDK" is the monthly usage report a company gets when it embeds our email editor in its own product. The numbers are Chamaileon App's actual October usage. We built it as the demo email for Chart, and our first test send got a few things wrong, which turned out to be the most useful part of the exercise.
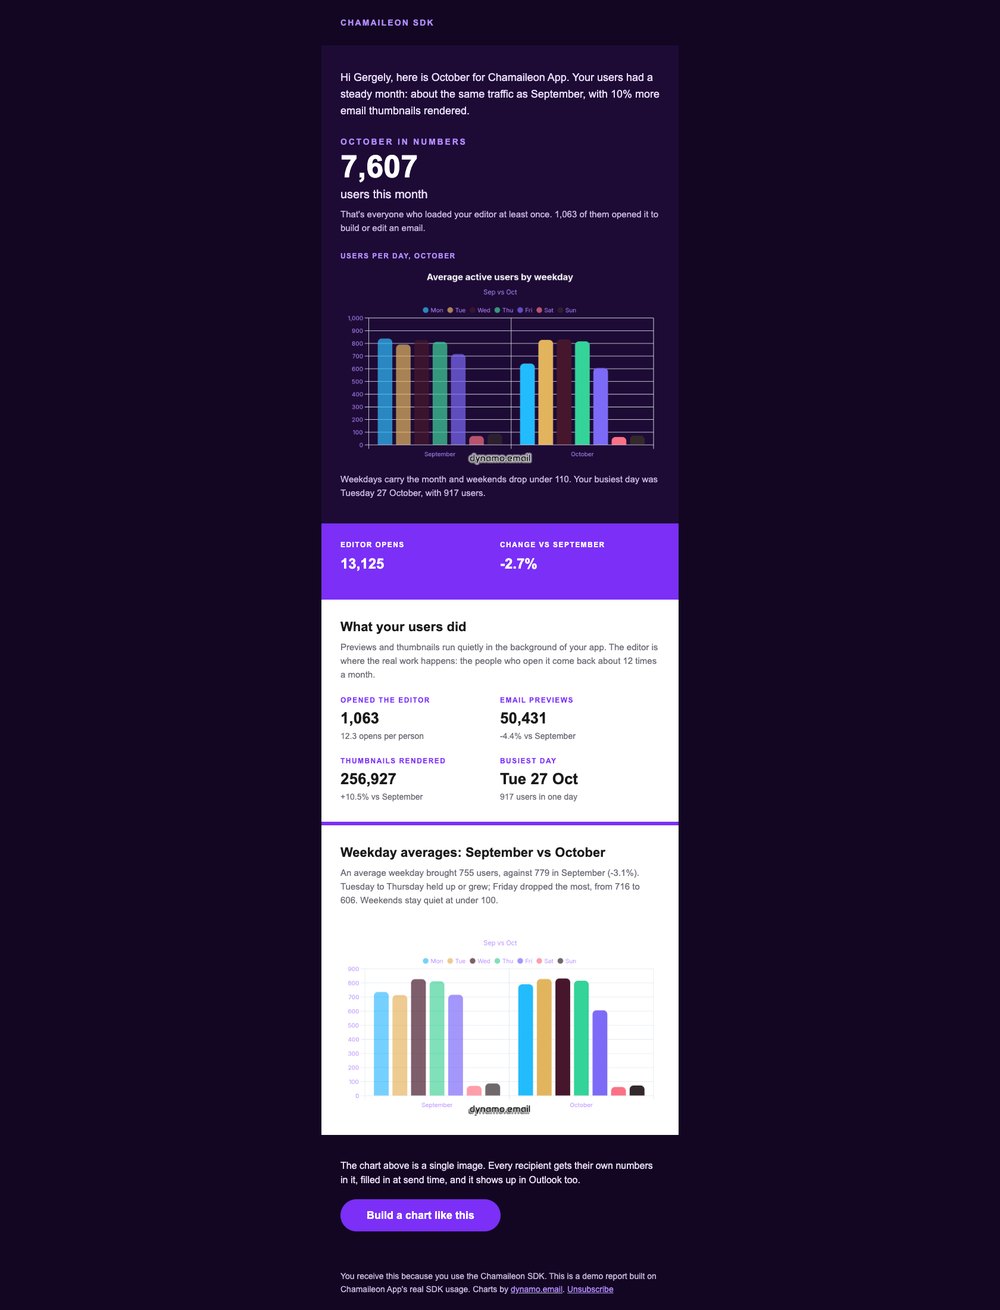
Top to bottom, the way it's meant to read:
- One opening sentence: a steady month, about the same traffic as September, 10% more thumbnails rendered.
- The headline number in live text. 7,607 users, and a line saying who counts as one.
- A line chart of users per day across October, one sentence under it.
- A purple band with two numbers: 13,125 editor opens, -2.7% on September.
- Four stat tiles: editor users, email previews, thumbnails rendered, busiest day.
- A bar chart of the average weekday, September against October. Then the button.
Two charts. The first draft had three.
Make it about the reader, not about you
Most usage data is boring. Logins, sessions, events. Nobody opens an email to find out how many times they clicked something.
The data isn't the problem, though. The angle is. A recent r/SaaS thread asked why the Duolingo and Grammarly recaps work so well, and why a homegrown one didn't. The founder asking had tried it and got "no actions, not many replies". They put the good ones down to the IKEA effect: people value what they had a hand in, and a recap shows them what they made. Two answers in that thread are worth stealing.
The first: show an outcome the reader cares about, not activity. One founder put it plainly: "Your user activation rate increased by X%" lands, "you logged in X times" doesn't. Grammarly doesn't count your keystrokes; it tells you that you were "more productive than 88% of Grammarly users". Duolingo doesn't count app opens; it shows your XP against last week and how long your streak is, things a learner is actually proud of.
The second: the numbers make or break it. Good numbers feel earned. Low or flat ones turn the same email into a nag. The teams that do this well send the recap when there's something worth celebrating, and something softer to everyone else.
Our SDK report had to pass both tests. Its reader isn't a Chamaileon user; it's the product lead who put our editor inside their own app. They don't care how often they log in to us. They care whether their users use the thing they built in. So every number in the email is about their users: 7,607 people loaded the editor, 1,063 built or edited an email, and those people came back about 12 times a month. That's the outcome of their integration, not our activity log.
The second test was harder, because October was a flat month: editor opens down 2.7%, an average weekday down 3.1%. The email doesn't hide that, but it doesn't open with it either. It starts on "a steady month" and the one number that grew, 10% more thumbnails rendered, and gives the dips their place further down, next to the chart that explains them: Friday fell, Tuesday to Thursday held.
And one gap we left open. Our demo sends the same template to Harbor Goods, one of our two made-up test accounts, whose editor opens fell almost 20%. Two charts of decline is exactly the nag the thread warns about. A real send would split it: the full report for accounts that grew or held, and for the ones that dropped, a shorter email with one number, one chart at most and one concrete thing to try next. One next step beats a page of graphs.
Which is the point of all this. A chart doesn't make dull data interesting. It makes the right data visible. Pick the number the reader would brag about or worry about, and the chart has a job.
Write the sentence before you draw the chart
A chart in a marketing email answers one question. You should be able to write the answer as a sentence before you open a chart tool. If you can't, the chart is decoration.
Our two charts each have their sentence:
- Users per day. Question: when do people actually use the editor? Answer: "Weekdays carry the month and weekends drop under 110. Your busiest day was Tuesday 27 October, with 917 users."
- Average weekday, September vs October. Question: better or worse than last month? Answer: "An average weekday brought 755 users, against 779 in September (-3.1%). Tuesday to Thursday held up or grew; Friday dropped the most, from 716 to 606."
The third chart was going to be "October reach by feature". Four bars: loaded the SDK, previewed an email, saw thumbnails, opened the editor. The values were 7,599, 7,390, 6,951 and 1,063.
Three tall bars of almost the same height and one short one. When I wrote its sentence, the chart had nothing left to add: "1,063 of them opened it to build or edit an email." That line now sits under the headline number and the chart is gone.
So a rough rule. One number carrying the finding is a stat, set in text. A chart earns its space when the finding is a shape: a weekly rhythm, a trend, several items compared at once.
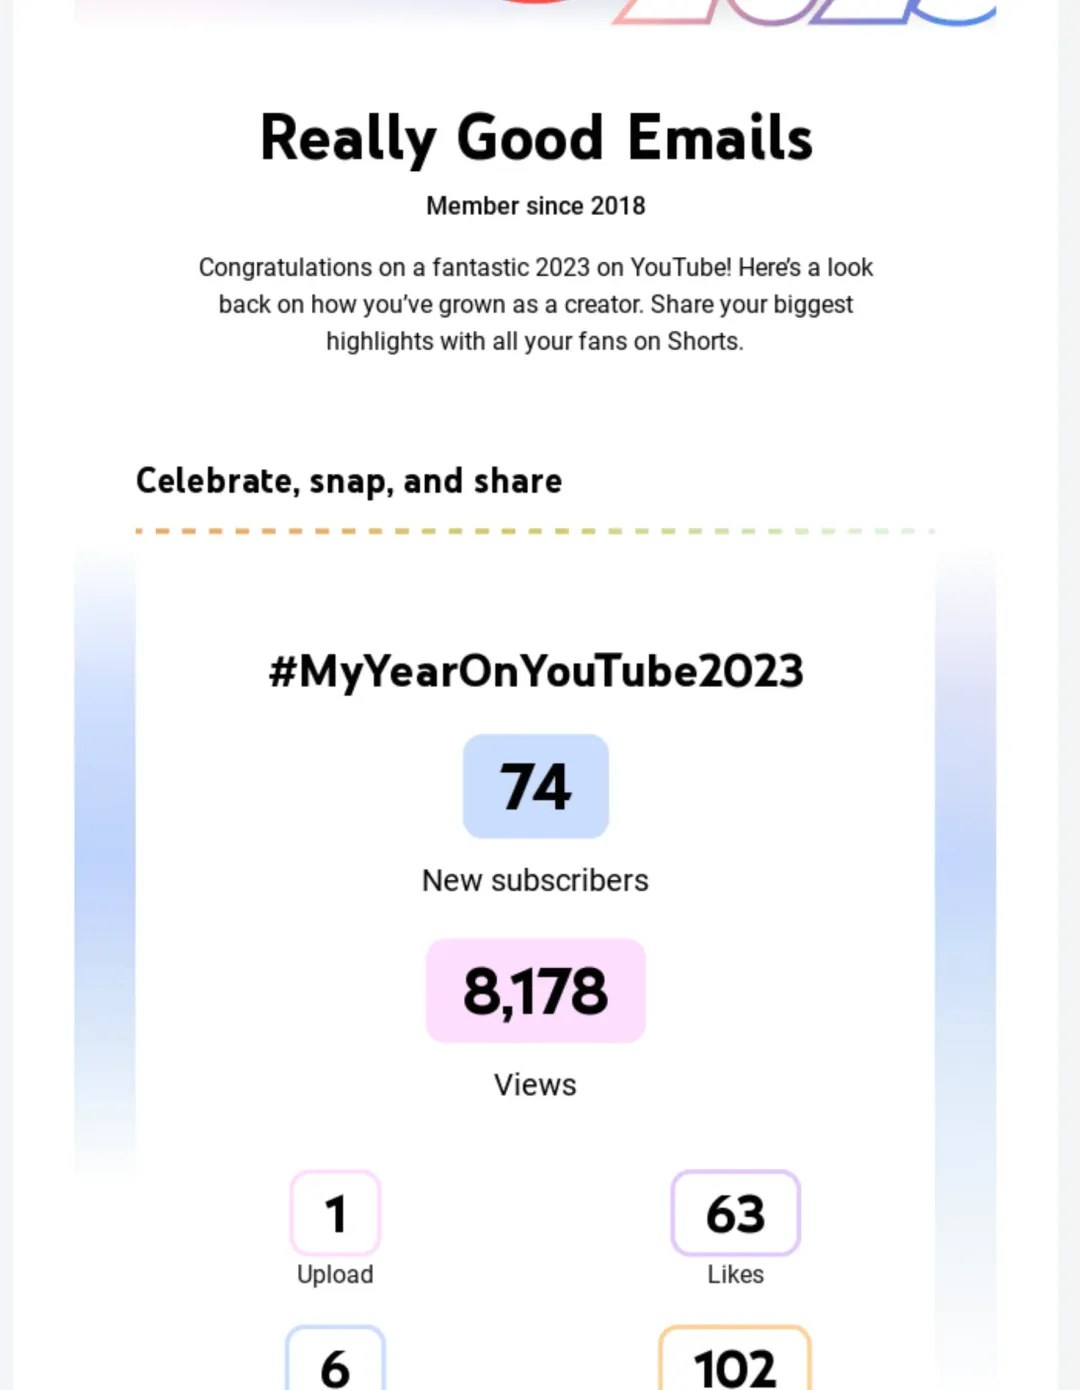
YouTube's year-end recap for creators takes that all the way. 74 new subscribers, 8,178 views, 1 upload, 63 likes: each one a big number with a one-word label, and not a chart in sight. There's nothing to compare them against, so a chart would only be a picture of one number. The design effort goes into making each number feel like a highlight instead.
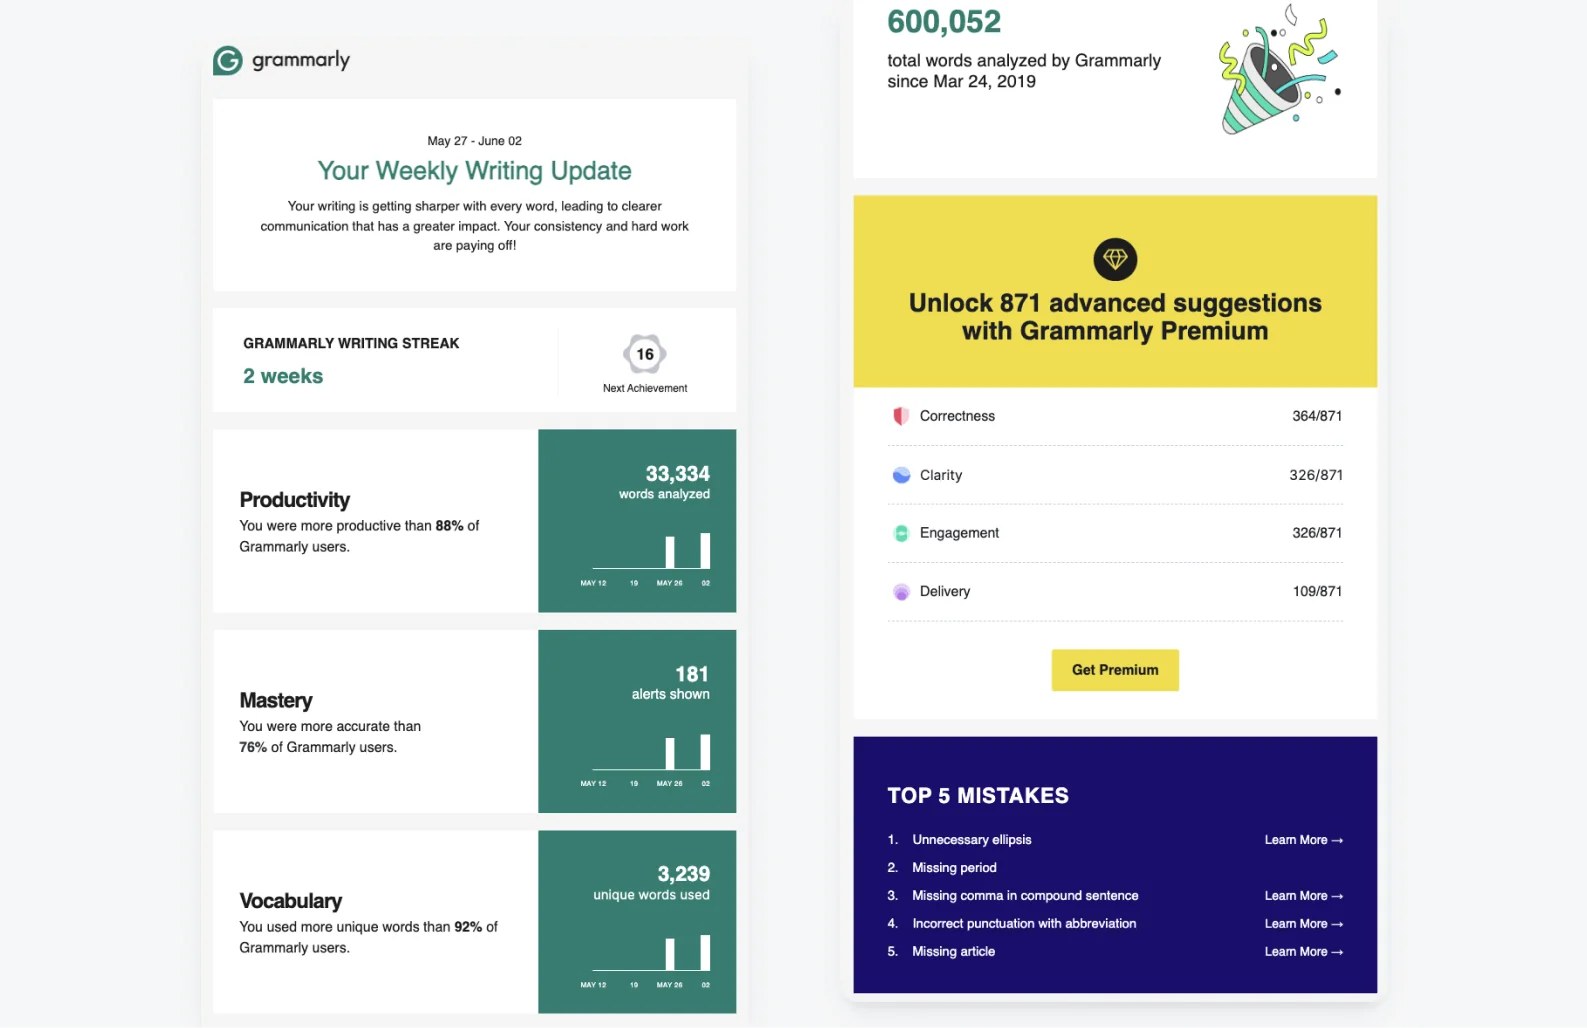
Some findings need no chart at all. Grammarly's weekly update (pictured further down) ends on a list: the top five mistakes, most of them with a Learn More link. When the finding is "these things went wrong", a short list with links does more than any chart could, because the next step is a click, not a look.
The sentence goes in live text, right next to the image, never only inside it. It reads with images off, it can carry merge tags so every recipient gets their own numbers in it, and it's what people read first anyway. Above the chart works best; the reader knows what to look for before they look.
Let the question pick the chart type
Once the sentence exists, the chart type mostly follows from it.
| The question | Chart | In our email |
|---|---|---|
| How did it move over time? | Line | Users per day, 1–31 October |
| This period against the last one, across a few items | Grouped bars | Each weekday, September next to October |
| How does a whole split up? (2–4 parts) | Doughnut | Not used; seats used vs open would be one |
| Where does someone stand on several scores? | Radar | Not used; fits a learner's skill profile |
Doughnut and radar are in the table for completeness. In an inbox both are hard work: slices are hard to compare at phone size, and a radar chart usually needs more explaining than an email has room for. We used neither.
Why a line for the daily chart: 31 bars on a 320px phone screen are hairlines with gaps between them. A line keeps the weekly rhythm readable, a weekday plateau and a dip every weekend, at any width.
Why bars for the weekday chart: seven days, two months, side by side. You compare each pair directly. A line here would suggest Monday flows into Tuesday, which isn't what the data says.
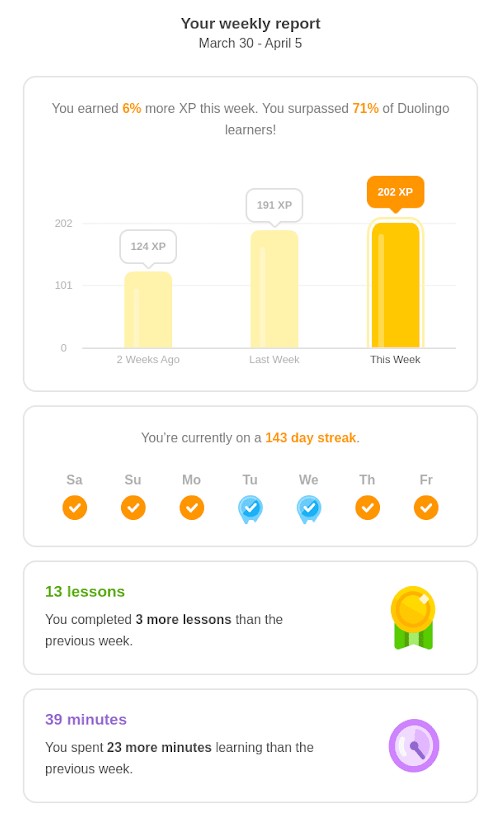
Duolingo's weekly report is the closest thing to our email in the wild, and it uses exactly one chart. Above it sits the sentence: "You earned 6% more XP this week." Below it, three bars: two weeks ago, last week, this week. Only this week is in full colour, the two before it are pale, and every bar carries its own value, so the comparison doesn't hang on colour alone. Lessons and minutes don't need a shape, so they get a tile each: an icon, a number and the change against the previous week.
Colour carries the comparison. September is a pale grey (#c9c4d9), October is the brand purple (#7b2ff7). The reader's eye goes to this month and uses last month as the backdrop. Two series is plenty; past two, the legend and labels start carrying more of the reading than the colours do. Colour shouldn't carry it alone either. Name both months on the chart, in a legend or as direct labels, so a reader who can't tell purple from grey still gets the comparison.
Design it for the inbox, not the dashboard
A dashboard chart gets a full screen and a curious user. An email chart gets about 320 pixels on a phone and a few seconds. Most of the design work is subtraction.
Size it once, scale it down. Our charts render as 640×400 PNGs and display at 536px: a 600px container minus 32px padding on each side. On mobile they go to 100% width with auto height. Never show a chart bigger than it was drawn; the labels go soft. If 640×400 looks soft at 536px on a retina screen, Chart has a retina (2x) export — use that instead of upscaling the same PNG.
Keep the title out of the image. "USERS PER DAY, OCTOBER" is small caps live text above the chart, in the email's own type. It reads with images off and it matches the rest of the layout. The image only has to carry the axes and the marks.
Short labels. 1 to 31. Mon to Sun. Anything longer gets rotated or truncated at phone width, and nobody reads a rotated label.
Make it work on any background. You don't control what the chart ends up sitting on. Some clients leave images alone in dark mode, others partly or fully invert colours or override styles, and it changes between versions. So don't design the chart for one background. Export it with a transparent background, so it isn't tied to a colour scheme, and give the marks, labels and figures colours that stand out on both light and dark: strong mid-tones, nothing close to pure black or pure white, which Microsoft notes tend to trigger inversion.
Microsoft's dark mode guidance pairs transparent images with "a subtle glow or stroke" to help them stand out. In Chart that's the glow setting: it adds a soft glow behind the chart, so it stays visible and legible in light and dark mode alike. Then test the exported PNG in Gmail, Outlook and Apple Mail, in both modes.
Split the work between text and chart. The stat tiles carry exact numbers: 1,063 editor users, 50,431 previews, 256,927 thumbnails. The charts carry shape. When both say the same thing, one of them is wasted. Ours still repeats the busiest day, once under the daily chart and once as a tile; next month one of them goes.
Grammarly's Weekly Writing Update splits it differently. Each metric gets a big number, a sentence comparing you with other users, and a tiny bar chart of the last few weeks beside it. The number and the sentence do the reading; the chart only shows which way it's going. At that size a chart can't carry more than a direction, and it doesn't try to.
When Outlook doesn't load the chart
Classic Outlook on Windows doesn't download external images until the reader asks it to, unless the sender is on their safe list. Other Outlook versions have their own settings, and plenty of corporate setups keep images off altogether. A chart is an external image, so for a good part of a B2B list the email opens with an empty box and a download prompt. Many people never click it.
What fills that box is the alt text. For everyone who doesn't load images, the alt text is the chart, so it deserves the same care as the chart.
The US government's Section 508 guidance on accessible email is a good baseline. Images that carry meaning need a text equivalent. Keep alt text under 250 characters, and if you need more, put it in the surrounding text or a caption. Skip "an image of", and end with a period.
For a chart, that means the chart type, then the finding with its numbers. Not "chart", not "users per day". Our first alt text was a near-copy of the sentence beside the chart. Tighter: "Line chart: users per day in October. Weekday peak of 917 on 27 October; weekends below 110."
Then make it personal. The chart's numbers arrive through merge tags in its URL, so the alt text can use merge tags too. Same send, same data: every recipient gets their own chart and their own description of it.
<img src="https://chart-api.dynamo.email/abc123/chart.png?v={{dau_oct}}"
     width="536" height="335"
     alt="Line chart: users per day in October. Peak of {{peak_users}} on {{peak_day}}; {{avg_weekday_users_oct}} on an average weekday."
     style="display:block; max-width:100%; height:auto; font-size:14px; color:#e9ddf7;">
For Chamaileon App that reads: "Line chart: users per day in October. Peak of 917 on Tue 27 Oct; 755 on an average weekday." For a smaller customer it's 117 on Wed 7 Oct and 91 on an average weekday, with no extra work.
If you map one merge tag per value, the alt text can reuse those exact tags. If a whole series travels in one tag, like our {{dau_oct}} — Chart expects the values star-separated, 1*2*3*… — 31 numbers in a row help nobody. Add a few summary fields next to the series (peak, average, change on last month) and put those in the alt. Count characters after the merge, not before: tags expand, and the 250 limit applies to what the reader gets.
Two small things on top. Style the alt text: font size and colour set on the <img> tag carry over to the alt text in many clients, so ours stays readable on the dark background instead of whatever the client defaults to. And keep the key numbers in live text around the chart anyway. Alt text covers the chart, not the rest of the email.
What our first test send got wrong
Look at the test send screenshot again. The charts came back wrong, and not one of the problems was about rendering. They were all data and setup.
| What we saw | Why | The fix |
|---|---|---|
| Both charts showed the same design | Both image URLs pointed at one saved chart ID | One saved chart per chart in the email; check the ID in every src before a test |
| The weekday bars made no sense | The chart was built transposed: September and October as labels, Mon–Sun as seven series | Labels are the x-axis (Mon–Sun), series are what you compare (Sep, Oct). When pasting from a sheet, first row = labels, first column = series names |
| Two bars nearly invisible | Seven series meant seven colours, and two of them sat too close to the chart's dark background | Series colours that stand out on light and dark, checked in the actual PNG, not the editor preview |
| The second chart lost its title | The chart has a white title on a transparent background. Transparent was right; white wasn't, because it only works on dark | Keep the title in live text outside the image. Anything left in the chart gets a colour that reads on light and dark, or Chart's glow behind it |
One more we caught before it shipped. If a merge tag comes through empty, the image server has nothing to draw. In Chart, an empty value list falls back to the chart's saved sample data, so the reader sees someone else's numbers presented as theirs. An empty series doesn't disappear either — it stays in the legend with nothing plotted against it, which reads as a bug if you weren't expecting it. Other tools fail in their own ways. Put a default value on every merge tag, and test with a recipient who is missing a field.
The pattern is worth saying out loud: once a chart is an image, the inbox stops being the risk. The data going into the URL is.
Mind what the chart gives away
Personal numbers are the whole point of a report email. They're also personal data, sent through a channel that was never built to keep secrets. An email passes through servers you don't control and sits in inboxes that get forwarded, shared and sometimes broken into. With a chart like ours there's one more exposure: the numbers are in the image URL itself, so they also pass through image proxies, caches and server logs. Anyone holding that URL can open the chart.
Strava is the cautionary tale here as well. Activity data that looks harmless on its own has given away far more than anyone meant to share, down to the position of a navy ship.
Treat the email like a postcard. Send what the reader needs to see, and nothing a stranger could use:
- Aggregates and trends, not raw records
- No locations, routes or addresses, and no timestamps that place a person somewhere
- No IDs, account numbers or anything else that identifies someone, in the chart or in its URL
- No health or financial detail you wouldn't want read over the reader's shoulder
If a number would be a problem in the wrong hands, keep it behind the login and link to it. That's the one job the link-only email still does best.
Before you send
- Every number is an outcome the reader cares about, not activity
- Accounts with a bad month get a shorter version with one next step
- Every chart has its sentence, written in live text above it
- Any chart whose finding fits in one number is a stat instead
- Line for time, grouped bars for comparisons, two series at most
- This period in the brand colour, the last one in grey, both named on the chart
- Title and key numbers in text, outside the image
- Labels short enough for a 320px screen
- Transparent chart background, with colours (or Chart's glow) that read on light and dark, checked in Gmail, Outlook and Apple Mail in both modes
- Alt text names the chart type and the finding, under 250 characters after the merge, with merge tags for each recipient's numbers
- One test with images off in classic Outlook
- Each image URL points at its own saved chart
- Every merge tag has a default; one test recipient has an empty field
- Nothing in the chart or its URL that would hurt in a stranger's hands
A chart that isn't yours
Here's an email that gets almost everything right. AWeber wrote to its users to say the Sent Messages page now shows open and click rates as charts. The copy is good. It says what changes ("without reading a table row by row"), what you can do with it (toggle between opens and clicks, click a bar to jump to that broadcast), and it gets to the point fast.
Then comes the chart. A Broadcast Performance panel: 47.2% open rate, 8.1% click rate, 27 broadcasts, 176,800 sends between January and July 2026, and a row of purple bars.
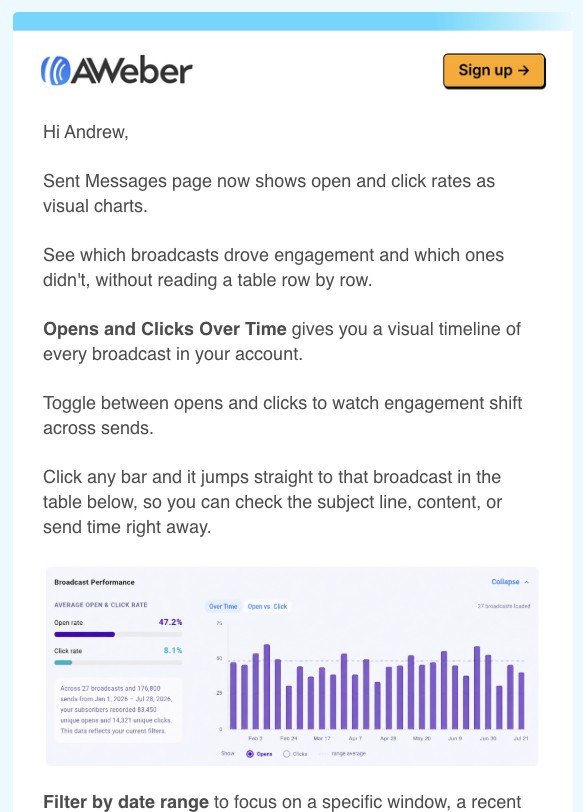
None of those numbers are Andrew's. It's a demo account, the same picture for every reader. The email knows his first name; AWeber also knows every open and click on every broadcast he has ever sent, because it sent them. It just didn't use them.
That costs more than it looks. A sample chart tells Andrew a feature exists. His own chart would have told him something about his list. Imagine the same panel with his last ten broadcasts as bars, and one sentence above it: "Your 14 April send got twice your usual opens. The new chart shows you why in one click." Now the email isn't announcing a feature. It's the first time he uses it, and the login is the obvious next step, not a chore.
There's a quieter problem too. The panel's own copy says "your subscribers recorded 88,450 unique opens". A reader skimming on a phone can easily take 47.2% for his own open rate, which is a strange thing to leave to chance in an email about reading your numbers properly.
And it's a screenshot of a dashboard, so it brings the dashboard's problems with it. The side panel's explanation, the axis labels and the legend were sized for a desktop screen; in the email they arrive at a fraction of that, and on a phone they're unreadable. A chart drawn for the email would keep the bars, drop the interface, and put the explanation in live text where it can be read.
None of this makes it a bad email. It's a good email one step short of a great one, and that step is exactly the one this article is about: the reader's own numbers, in a chart made for the inbox.
Same email, everyone's own numbers
Our SDK report went out with Chamaileon App's numbers. The same send can go to every SDK customer, each getting their own 7,607 or 937 or 2,245 in the text, and their own October in both charts.
That works because the chart is an image whose numbers travel in its URL, filled in by merge tags at send time. Nothing runs in the inbox and nothing is connected to your ESP, so it renders in Outlook like any other image.
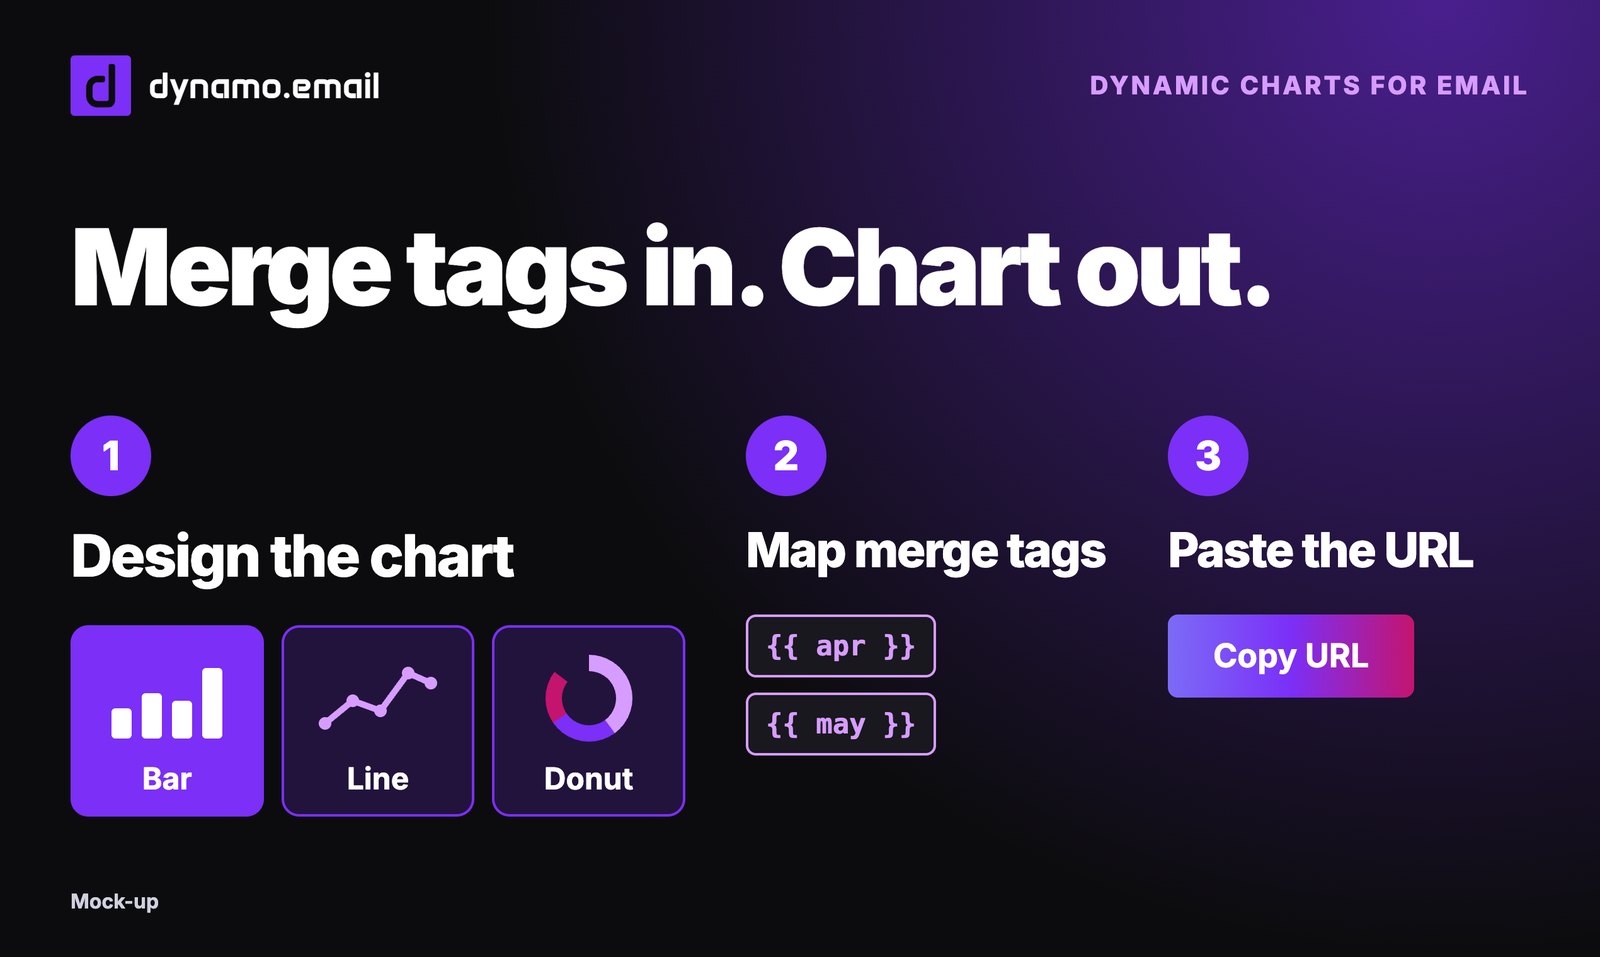
The charts in this email were made with Chart from dynamo.email: pick a type, paste the data from a spreadsheet, style it once, copy the URL.
Sources
- How to create a Spotify Wrapped-style campaign, Customer.io (YouTube recap example)
- Accessible Email Messages, Section508.gov (reviewed October 2026)
- Improve email accessibility for light and dark modes, Microsoft Learn (updated October 2026)
- Thread on user stats recap emails, r/SaaS
- Strava data and the navy ship, BBC News
- Strava monthly stats emails, AWeber's Sent Messages chart announcement, Duolingo weekly report and Grammarly Weekly Writing Update: screenshots of the emails as received
- Spotify Wrapped email example, Mailmodo
- Chamaileon App SDK usage, October 2026 (internal data behind the example email)