One chart. Different figures for each subscriber.
Chart shows data from your merge tags automatically, so every person sees their own figures, anytime they open the email. Prefer one shared chart instead? Build it in the live editor, style it to your brand, and paste one hosted URL into any ESP.
at a glance.
How it works
From data
to hosted chart.
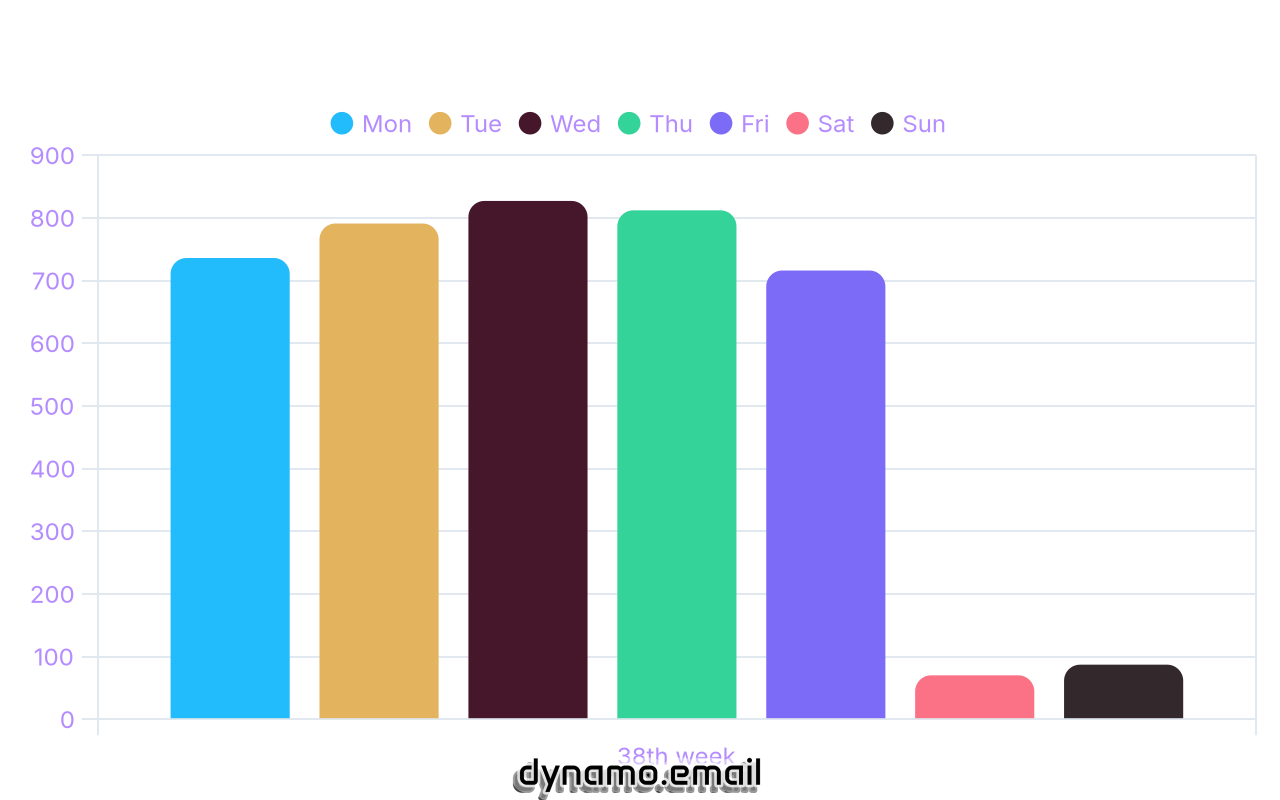
This isn't a static picture. Drop your ESP's merge tags into the image URL and Chart renders using whatever list data your ESP fills in for each subscriber — automatically, no separate integration. So one image shows a different number for every person on the send.
Chart types
Common chart types.
One editor.
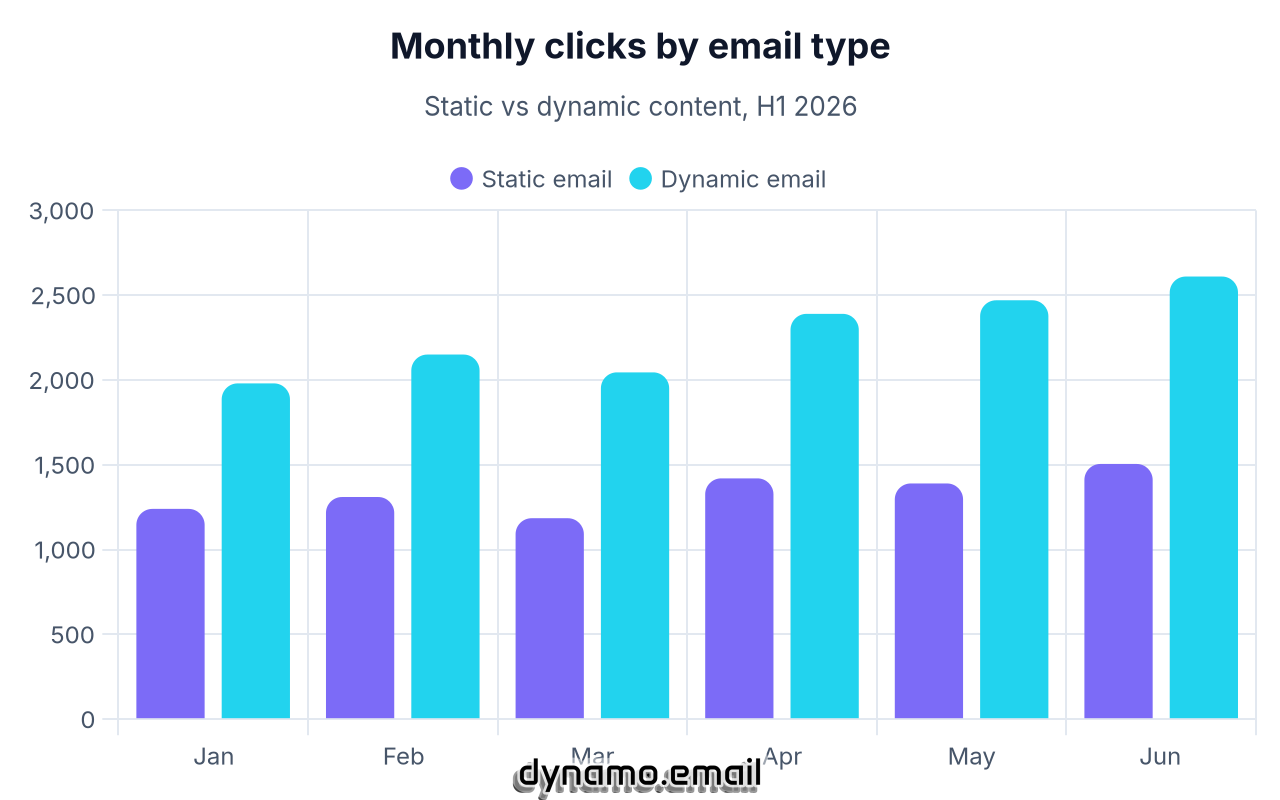
Compare campaigns, regions, or quarters at a glance. Edit the data and styling, see the chart update live, then ship it as an image.
Why Chart
Built for the inbox.
Works everywhere.
Built for
Who uses Chart?
Finance & Reporting
Monthly numbers, made readable.
Drop your ESP's merge tags into the chart so stakeholder and investor updates always show the latest numbers, not last month's export.
SaaS & Product
Each user, their own chart.
Drop your ESP's merge tags into the chart and every subscriber's usage or billing email renders their own numbers, live, at open-time — no per-user batch exports.
Newsletters & Editorial
Data stories, in the inbox.
Illustrate a point with a chart instead of a paragraph of numbers.
Agencies
Client reports without the screenshots.
Produce consistent, on-brand charts for every client send.
FAQ
Got questions
about Chart?
Everything you need to know about chart types, formats, and getting your first chart into an email.
Chart is Dynamo's chart editor for email. Build a chart and get a hosted image URL for any ESP, or drop in your ESP's merge tags so each subscriber's email renders their own live numbers at open-time.
TODO: confirm the full list of chart types in the editor (the staging editor is based on Chart.js configs).
Charts are rendered as images so they work in every email client. TODO: confirm exact output format (PNG/other).
Yes — that's the point of Chart being an image, not a flat export. Build the chart manually for a one-off shared visual, or drop your ESP's merge tags into the URL and Chart renders that subscriber's own list data automatically, every time they open the email. No batch exports, no per-user screenshots, no separate integration.
TODO: confirm anonymous vs. account requirement with the product team before launch.
Chart is free to try with a small "Powered by Dynamo.email" watermark. Upgrade to Pro for $99/year + VAT if applicable to remove it.
Yes, this page is full of AI, and so is its design. We build tools, not designs or fancy landing pages, and that part is your craft, right? So we developed the tool backends ourselves and let an LLM help with the UI and with this page. It still went through several rounds of human review, and everything on it is based on facts.
Pricing
Simple, flat-rate pricing.
Free to try with no time limit. $99/year per product + VAT if applicable to go watermark-free. No per-seat fees or other nonsense.
Build charts with no time limit. Generated images include a small "Powered by Dynamo" watermark. No card required.
- Live chart editor
- Unlimited generations
- Custom colors and labels
- Works with any ESP
- Watermark on all assets
Remove the watermark. Your brand, your emails. Unlock priority support.
- Everything in Free
- No watermark — your brand only
- Priority email support
Usage-based fees may apply for high-volume usage.